Green Deal update – 6,000 to 10,000 more Green Deal plans by March 2015?

Monthly growth rates have jumped for the six months to July compared to the six months to June, Extrapolating recent growth rates to June and to July, we expect a total of 10,000 to 14,000 Green Deal plans by the end of March 2014.

Request a copy of our presentation on projections and analysis of the latest Green Deal statistics by emailing us at tvf@theventuringfirm.com .

The Green Deal was launched in early 2013; DECC has recently published the latest statistics through to July 2014.

A pick-up in growth rate is driving up projections for Green Deal plans

Monthly growth rates have jumped for the six months to July compared to the six months to June.

2014-08-23 GD plan projections

With recent growth trends continuing, we project between 6,000 and 10,000 more Green Deal plans being confirmed before the end of March 2015.

This is based on extrapolating recent compound monthly growth rates of 13% for the six months to June and 17% for the six months to July – a substantial jump.

With this extrapolation, we expect a total of 10,000 to 14,000 Green Deal plans by the end of March 2014.

Higher growth drives up projections for Green Deal Provider workloads

Growth in plan numbers outstrips growth in Green Deal Provider numbers, driving up utilisation.

2014-08-23 GDP workload projections

With recent growth trends continuing, we project between 28 and 36 pre-live plans on average for each Green Deal Provider by March 2015.

This represents an increase in Green Deal workload for Providers of between 115% and 170%.

This is based on extrapolating recent compound monthly growth rates for Green Deal plans and for GD Providers.

With this extrapolation, we expect more than doubling in workload on average for each Green Deal Provider by March 2015.

Further insights from the latest statistics

Growth in Green Deal plans is the strongest since April, driven by accelerating growth in assessments.

The strong growth in assessments is now being seen in newly confirmed plans and plans new to installation.

Growth in confirmed plans is being driven by new plans rather than delays in moving plans to installation.

The bottleneck in processing confirmed plans has dropped off rapidly since May, with fewer than 15% of plans ‘stuck as confirmed’.

A bottleneck is beginning to grow again in installation, with over 20% of plans taking longer than two months to install.

Whilst improving, a reasonable view of current average workloads is that underutilisation continues to be a feature of Green Deal work.

See more

Request a copy of our presentation on projections and analysis of the latest Green Deal statistics by emailing us at tvf@theventuringfirm.com .

Subscribe to this blog – on the left – to receive further updates to our analysis of the Green Deal. The next update will be soon after publication of the next monthly report by DECC on 23rd September.

To learn more about The Venturing Firm, please look at http://www.theventuringfirm.com/ .

Sources

DECC, “Domestic Green Deal and Energy Company Obligation in Great Britain, Monthly report”, 21st August 2014, https://www.gov.uk/government/publications/green-deal-and-energy-company-obligation-eco-monthly-statistics-august-2014


What makes the UK energy market so attractive for innovation and disruption?

The UK domestic energy market is worth around £66 billion a year and has doubled in size over the last ten years. What makes this an attractive market for innovation and what is the potential for disruption?

The market

Around £32 billion a year is spent on electricity, gas and other domestic fuels, across over 26 million households. They also spend an additional £34 billion per annum on petrol and diesel for their personal transport.

The market has doubled over the last ten years (2002 to 2012).

Total household spending on energy

Spending on home energy – electricity and gas – is a relatively small element of overall spending for most households. Spending on domestic electricity and gas accounts for around 8% of total spending for the lowest income households, and falls to under 5% for those with above average income. On average, it is roughly equivalent to spending on clothing and footwear, or around a third of spending on recreation and culture.

However, when combined with spending on petrol and diesel, total spending on home energy and transport fuels comes to around 10% for most households in the UK. Only the highest income decile spends a smaller share on energy.

The chart below summarises domestic energy spending in the UK by household income in 2012. The data comes from ONS Family Spending 2013 (see http://www.ons.gov.uk/ons/rel/family-spending/family-spending/2013-edition/index.html) and is by household disposable income decile for calendar year 2012.

Spending - UK home energy and transport fuels (2012), bold

The chart is split in two – a column chart at the top showing monthly spending on home energy, transport fuels and total monthly spending; and a line chart at the bottom showing the share of total household spending on home energy and transport fuels.

The horizontal axis is split into household disposable income deciles (each decile represents about 2.6 million households), with the lowest income decile to the left and highest income decile to the right.

The monthly spending on home energy rises from £65 p.m. on average for the lowest income decile (from the column chart) to £146 p.m. on average for the highest income decile. This represents 7.8% of total household spending for the lowest income decile, falling t o3.2% for the highest income decile.

Also, monthly spending on transport fuels rises from £24 p.m. to £212 p.m. on average from lowest to highest income decile. However, this represents 2.8% of total spending for the lowest income decile rising to a peak of 6.1% for higher income deciles.

When combined spending on home energy and transport fuels represents around 10% of total spending for all households except the highest income decile.

The opportunity

The UK energy market is massive – domestic spending on home energy and personal transport fuels of around £66 billion per year.

Spending on energy of around 10% of total household spending for most households represents an attractive opportunity for ventures that can make credible and compelling propositions to reduce energy consumption and energy costs (and reduce emissions footprints).

DECC’s projections for energy prices through to 2030 show, for example electricity prices expected to increase by a third by 2020 and by a half to 2030.

Projected domestic energy prices

The market is undergoing a number of transformational changes over the next decade, including:

  • Growing prominence of renewable technologies in the generation mix, displacing fossil fuels
  • Decarbonisation of domestic heating and personal transport in support of moves towards an ever smaller emissions footprint
  • Increasing penetration of micro-generation technologies at household and community level
  • Adoption of smart technologies (such as the roll-out of smart meters) and energy efficiency measures which typically generate consumption savings of around 20% in the first 12 months
  • More pervasive instrumentation of energy systems alongside developments in Internet-of-things and big data technologies (e.g. driven by Smart City initiatives)

And, in recent years the UK energy market has rarely been so attractive for new entrants:

  • Ofgem has recently referred the market for the supply and acquisition of energy in Great Britain to the Competition and Markets Authority (CMA) for investigation
  • Political attention on the UK energy market and especially the big 6 energy suppliers remains high and is likely to increase in the run up to the general election in May 2015
  • Public distrust in the big 6 energy suppliers remains high with complaints (mainly about billing) jumping in 2014
  • Ofgem continues to take a positive and supportive stance to innovation in the energy markets, particularly whilst it waits for the results of the CMA investigation
  • Transactions such as the recent acquisition of Nest Labs reinforces the high valuations possible for innovative tech solutions in the energy market

Conclusion

The UK domestic energy market is massive and is undergoing a number of transformational changes over the next decade.

Projections for unit price increases suggest continued rapid increase in electricity costs. With a move to electrification of heat and transport, householders may be hit doubly hard by the growing share of electricity in energy consumption and the increasing unit price of electricity.

If so, demand will grow from householders for reduced consumption and lower prices. This gives rise to opportunities for new consumption models (and the business models enabling them) and technologies that transform generation and distribution costs.

The Venturing Firm has tracked innovation in the energy market for over 10 years and worked with new ventures targeting new business models, new go-to-market approaches and new products and services.

If you are active in exploiting the transformational changes described above, we are keen to hear from you.

An opportunity for disruptive change in the UK energy market?

On 27th June 2014, Ofgem referred the market for the supply and acquisition of energy in Great Britain to the Competition and Markets Authority (CMA). This article briefly describes the nature of the CMA investigation, market issues highlighted as context for or to be addressed by the investigation and five related opportunity areas for innovators in the UK energy market.

The investigation

Ofgem ran a consultation on referring the gas and electricity supply markets to the CMA in May 2014 – respondents approved the move, with the following main reasons:

  • Restore consumer confidence
  • Fix problems with the market
  • Support investor confidence

CMA will determine what if anything restricts or distorts competition in supply and acquisition of energy in GB.

The approach to be adopted by the CMA team is:

  • define gas and electricity supply markets
  • assess nature of competition
  • reach a view on whether anything prevents, restricts or distorts competition;
  • decide whether CMA/ others should take action to remedy any ‘adverse effect on competition’

Detrimental effects on customers requiring some form of response could include: higher prices, reduced service quality; reduced choice of product or supplier; reduced innovation; insufficient supply in the future

The scope of the investigation includes wholesale and retail markets, and for the latter for supply to households and micro-businesses only. The investigation may address aspects such as industry code requirements, roles of third-party intermediaries and bundled ancillary goods and services. It will not address wholesale gas markets, gas interconnection and storage, and regulation of revenues from transmission and distribution. The scope of the investigation has been challenged by the Environment and Climate Change Select Committee, who prefer the wholesale gas market to be within scope.

Market issues

A long list of market issues has been highlighted as context for or to be addressed by CMA’s investigation. Issues of particular relevance for innovation and disruption, in brief, include:

Structural inertia
  • Vertical integration
  • Market power – supply concentration/ tacit coordination
  • Central system operator and one transmission/ distribution network
  • Degree of regulatory and political intervention
  • Regulatory dampening on early-stage expansion
  • Single European energy market
Wholesale market inefficiencies
  • Opaque pricing, liquidity and imbalance pricing reforms
  • Contracts for difference to underwrite price for low carbon generation technologies
  • Capacity markets to incentivise investment in generation
  • Electricity storage costs
  • Economic disincentives for independents (retailers and generators):
    • High transaction costs to avoid imbalance costs (up to 1 hour before delivery)
    • High hedging costs (illiquid market in hedging products)
    • Poor quality price signals (driving investment decisions)
    • Credit and collateral costs, regulatory and system costs
Retail market inefficiencies
  • Tariff simplification
  • Micro-generation/ on-site renewables
  • Smart metering
  • Time-of-use tariffs
  • Switching/ customer inertia
  • Disconnect between wholesale price signals and consumer behaviour
  • Public mistrust and reputational risk

It’s a long list, so it’s unsurprising that the CMA is expected to take 18 months to complete the investigation.

Opportunity areas

The instigation of this investigation has highlighted a range of issues that may be restricting or distorting competition in the UK energy market. These shed light on areas of market inefficiency and unmet or poorly met customer needs, which suggest where the priorities for innovation lie.

Some areas in the UK energy market offering opportunities for innovation include:

Smart energy

Smart energy is about more than just smart meters: smart energy is about the technical and commercial elements needed to introduce intelligence into energy consumption without the need for human intervention – it’s about personalised tariff structures, immediate and automated switching on price signals, predictive maintenance and zero-outage, self-organising local energy markets, automated energy management, microgrid balancing mechanisms and so on

Decarbonising transport and heat

Today, transport and heat are dependent on fossil fuels: if we are to reduce emissions towards 0%, some ubiquitous alternative to fossil fuels is required for transport and heat – two enormous and complex challenges face us, firstly of changing to an alternative transport fuel (as well as building the enabling supply and distribution infrastructure, and changing how the automobile industry works) and secondly of transitioning the nation’s boilers (alongside reducing demand by transforming construction techniques and materials, and improving the energy efficiency of the existing housing stock).

Energy storage

Demand for energy storage technologies is being driven by the move to electric vehicles (batteries) and the deployment of renewable generation (dealing with intermittency and mismatch in supply/ demand): electricity is currently very costly to store, and energy storage is very much the missing transformative technology in the energy sector – whilst technology breakthroughs are desirable (and the realm of R&D), commercial innovations and novel business models may be an earlier driver of opportunities

Local networks

Local energy networks, microgrids and energy service companies (ESCOs) are being actively discussed in industry fora, though clear commercial models have yet to emerge: there is increasing de facto local involvement in energy systems through distributed generation, demand response, group purchasing schemes, and so on – for value to be realised a change in value chain configuration is required with value flows from traditional energy system players (e.g. the big 6) to new players closer to end consumer

The retrofit problem

Centralised network models have not provided the economic incentives to encourage the mass uptake of smaller scale renewables and energy efficiency improvements required to reduce the emissions footprint particularly of the existing building stock: with several government-backed schemes over years having failed at driving change at scale, the solution may lie in an alternative direction – looking for business models predicated on reducing energy bills to £0 (who would benefit, for example, from a change to charging for household services rather than energy supply?)

Conclusion

TVF has tracked innovation in the energy market for over 10 years and worked with new ventures targeting new business models, new go-to-market approaches and new products and services.

The energy market offers plenty of obstacles to innovation, many of which the CMA investigation promises to consider.

Does the investigation offer a chance to reshape the market and its institutions to support greater freedom for innovation and experimentation? We hope so and will be following its progress keenly.

In the meantime we continue to track developments in the opportunity areas described above and, if you are active in one of these areas, we are keen to learn more about your ambitions and achievements.


Green Deal update – headline growth numbers hide falling conversion rates


The latest report confirms continued growth in Green Deal plans. Dig a little deeper and there are falling conversion rates, a bottleneck before installation and continued low utilisation of Green Deal providers and installers.

The Green Deal was launched over a year ago in early 2013. DECC has recently published the latest statistics through to June 2014.

Headline numbers show continued growth in Green Deal plans

Growth in total Green Deal plans has been relatively strong over the last four months following a short hiatus at the start of 2014.

By the end of June 2014 3,234 plans have been confirmed since the Green Deal was launched, up 16% on May.

Green Deal plans by stage of development

However, measuring by compound monthly growth rate, monthly growth for the six months from January to June 2014 was 13% p.m., down from 31% for July to December 2013.

That said, 13% growth per month represents a tripling in size over a year.

Falling conversion rates and flat ‘new’ plans

Conversion rates are falling at each stage of development for GD plans:

  • In June, there were 406 newly confirmed Green Deal plans, up 4% on May – a conversion rate from assessments of around 1.7%, down from 1.8% for May
  • 283 plans were newly being installed in June, 1 plan more than in May – a conversion rate from confirmed plans of around 33% in June, down from 37% in May
  • The number of newly live plans were up 11% on May, to 215 newly live plans in June – a conversion rate from being installed of around 36%, down from 38% in May

Falling conversion rates

A bottleneck exists pre-installation

The number of confirmed plans grew by 14% in June compared to May, continuing a trend over the last few months.

This growth was driven by a build up in existing confirmed plans, those yet to start being installed. It is taking longer to start installation for GD plans, indicating a pre-installation bottleneck.

A bottleneck exists pre-installation

An increasing number of new plans are being installed, though the growth in plans being installed has been about half the growth in confirmed plans, over the last three months.

Utilisation remains very low

Advisor numbers have continued to grow and now stand at over 4,000, up 7% on May. Advisor utilisation has increased from around 4 assessments per advisor per month on average in December 2013 to around 7 in June 2014, showing a much improved situation. Of course some advisors will be busier than others, though on average this still represents substantial under-utilisation for work related to Green Deal.

Advisor utilisation

There was no increase in the number of Green Deal providers in June 2014. Utilisation of Green Deal providers has increased to around 10.5 pre-live plans per provider in June 2014. However, this increase is driven mainly by the number of existing confirmed plans (see earlier comments on bottleneck).

GD provider utilisation

The number of Green Deal installers rose by around 3% in June. Utilisation of installers has improved over the last five months, rising from a low of 17 plans per 100 installers in February to over 24 plans per 100 installers in June. Whilst installer numbers are relatively flat, it is hard to argue this is the driver of the pre-installation bottleneck, as utilisation on Green Deal work remains exceptionally low.

Installer utilisation

What’s next

Subscribe to this blog – on the left – to receive further updates to our analysis of the Green Deal. The next update will be soon after publication of the next monthly report by DECC on 21st August.

To learn more about The Venturing Firm, please look at our web site.

Sources

DECC, Green Deal and Energy Company Obligation (ECO): monthly statistics (July 2014), 22nd July 2014, https://www.gov.uk/government/publications/green-deal-and-energy-company-obligation-eco-monthly-statistics-july-2014

Green Deal update – what’s behind the headline growth numbers?

The Green Deal was launched over a year ago in early 2013. DECC has recently published the latest statistics for May 2014. At the same time, DECC published the results of its Green Deal customer journey survey.

June’s report on the latest statistics confirms continued growth in Green Deal plans. Dig a little deeper behind the numbers and there are static conversion rates, continued low utilisation of Green Deal providers and installers, and a potential bottleneck forming before installation.

Customer need

Improved energy efficiency is a major component of how the UK aims to reduce its emissions footprint and achieve its carbon targets.

The challenge, and the big win, is in solving the retrofit problem.

The Green Deal is an attempt by government to engage the majority of householders in investing to improve the energy efficiency of their homes, thereby reducing energy demand (and bills) and cutting emissions.

JUN14 GD plans to end May-14

Households spend around £32 billion on domestic energy each year and the price of electricity for domestic customers has increased by around 6% on average over the last few years.

Reasons given by householders for having a Green Deal assessment were to cut energy bills (52%), because the assessment was free (46%), to make their home warmer or more comfortable (37%), because of concerns over rising bills (31%), because improvements may be free or at greatly reduced price (23%) and to improve energy efficiency (22%).

Affordability – in the form of cutting bills and taking advantage of free services – is a common theme.

Assessments

Around 23,800 assessments were carried out in May 2014, up 8% from around 22,000 in April. There were 839 newly confirmed Green Deal plans in May 2014, indicating a conversion rate of around1.8%, the same as for April and the highest since September 2013.

JUN14 Assessment to Confirmed conversion rate

The number of assessments not converted to Green Deal plans since May 2013 now stands at around 230,000. However, some of these assessments may have resulted in installations under ECO or through self-financing.

Advisor numbers have continued to grow and now stand at 3,747, up 5% on April. However, the number of assessor organisations has fallen for the first time. Advisor utilisation has remained at around 6 to 6.5 assessments per advisor per month on average. Of course some advisors will be busier than others, though on average this still represents substantial under-utilisation for work related to Green Deal.

JUN14 Assessor utilisation

With up to 75% of households not paying for assessments, this represents an investment of £millions in marketing (or ‘loss leader’) activities for Green Deal. And with conversion rates remaining low and flat despite this investment, the sustainability of the go-to-market model must be questionable.

Of those householders having chosen to install a measure following an assessment, the payment method used included: it being free or paid for by the local authority (38%), third party (not Green Deal) finance arranged through the Green Deal provider (17%), use of ECO subsidy (16%), from personal savings (14%) or using Green Deal finance (2%).

Confirmed plans

The number of newly confirmed Green Deal plans is down 11% on April to 389 plans. The number of outstanding confirmed plans, i.e. not yet being installed, continues to rise and stands at 863 in May 2014, up 14% on April. The pool of confirmed plans represents around 60% of all pre-live plans, up from 50% in February.

JUN14 Pool of confirmed plans

Over the last three months, around 40% of confirmed plans have started being installed each month. The time spent before being installed is around 2.5 months on average.

JUN14 Dynamics of Confirmed to Installing

The number of Green Deal providers continues to increase, standing at 151 in May, of which 144 serve the domestic market. Utilisation of Green Deal providers is increasing and is at around 9.5 pre-live plans per provider in May 2014, the highest level experienced so far.

JUN14 GDP utilisation, pre-live

Whilst encouraging, these numbers represent low utilisation for Green Deal providers.

Plans being installed

The number of plans newly being installed (i.e. moving from confirmed) continues to grow strongly, up 31% on April and around three times the number in February. The total number of plans currently being installed has grown over the last four months, accounting for 40% of pre-live plans, down from around 50% in February and 60% in October 2013.

JUN14 Pool of installing, 1000

The number of plans being installed has grown less quickly than that for confirmed plans (i.e. those not yet being installed). Does this indicate a bottleneck in moving plans from confirmed to installing?

In each of the last two months, around 40% of plans have completed installation and become live, up from below 30% in March. Plans now spend around 2.5 months being installed, down from around 3.5 to 4 months in March.

The age profile of plans being installed has become younger over the last three months.

JUN14 Installing, age of plans

The number of Green Deal installers rose by less than 1% in May, effectively flat. Utilisation of installers has continued improving over the last four months, though slowly and stands at more than 20% less than the peak in 2013. In May 2014, around 22.5 plans were being installed for every 100 Green Deal installers, on average.

JUN14 Installer utilisation

The most commonly installed measures using Green Deal finance in May 2014 were Solar PV (33% of measures reported as being installed), new boiler (22%) and cavity wall insulation (15%). This differed somewhat from stated intentions after completing the assessment.

JUN14 What do you intend to do

Draught proofing and hot water cylinder insulation were commonly stated intentions for installation, with almost none being done using Green Deal finance, most likely due to the low cost involved. There were relatively fewer stated intentions to install boilers and solar PV following assessment, though both were the most commonly installed measures using Green Deal finance.

Overall householder satisfaction with installation of measures is high, with 84% or more rating very or fairly satisfied across a range of metrics.

JUN14 Satisfaction with installation

The only prominent source of dissatisfaction (among those factors tested) was from how clean or tidy the home was left following installation.

What’s next

The analysis will be updated following publication of the next monthly report on 22nd July.

Subscribe to this blog – on the left – to receive further updates to our analysis of the Green Deal.

To learn more about The Venturing Firm, please look at our web site.

Sources

DECC, Green Deal and Energy Company Obligation (ECO): monthly statistics (June 2014), June 2014, https://www.gov.uk/government/publications/green-deal-and-energy-company-obligation-eco-monthly-statistics-june-2014

DECC, Green Deal customer journey survey, June 2014, https://www.gov.uk/government/publications/green-deal-customer-journey-survey-summary-report-quantitative-survey-wave-2

Green Deal Oversight and Registration Body, http://gdorb.decc.gov.uk/find-a-green-deal-supplier/advanced

Retirement finance: is the pension industry ready for radical change?

In the 2014 Budget, the UK Chancellor announced changes to pension rules meaning retirees are no longer forced to buy an annuity with the proceeds of defined contribution pension schemes.

Whilst the details and implications have still to be worked through, this simplification may well lead to wide ranging changes to the insurance, fund management and IFA sectors and possibly beyond, opening the door for innovators to reform a poor customer experience offering limited product choice.

What is the UK pension market?

The retirement finance market is an interesting one – a massive market that continues to grow, served by an outdated sector built around a single product (with limited variations) and offering a poor customer experience, whilst operating with high costs and low transparency, and addressing only a very narrow part of customers’ in-retirement needs.

Saving for retirement

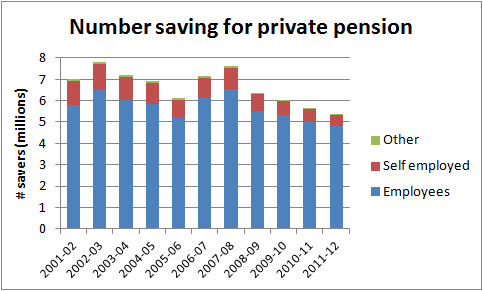
In 2012 there were over 5 million saving for a private pension, falling from around 7.5 million in 2008, most saving through occupational schemes. [Source: HMRC]

Ch1 Number saving for private pension

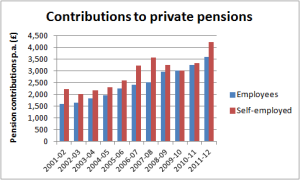
Contributions to private pensions have increased steadily over the last decade, doubling from around £2,000 p.a. in 2004 to around £4,000 p.a. in 2012. [Source: HMRC]

Ch3 Contributions to private pensions

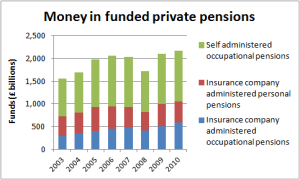
The funds held in private pension schemes have increased steadily to over £2 trillion in 2010 (with an understandable drop in 2008). Over the last decade there has been a trend away from defined benefit schemes to defined contribution schemes with almost 40% of occupational pension schemes in 2012 being defined contribution, up from around 25% in 2007. We estimate about half of private pension funds – £1 trillion – are affected by the recently announced changes. [Source: PPI]

Ch4 Money in funded private pensions

Planning for retirement

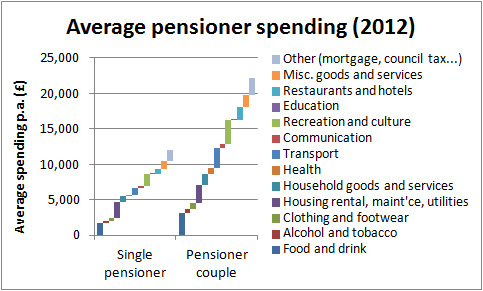
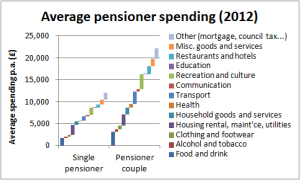
There are over 12 million people at pension age with over 8 million pensioner households and life expectancy at 65 is now around 25 years. Average spending each year for single pensioners is around £12,000 p.a. and for pensioner couples around £22,000 p.a., with most spending on food and drink, housing costs, transport, recreation and other costs (incl. council tax). [Source: ONS]

Ch7 Average pensioner spending

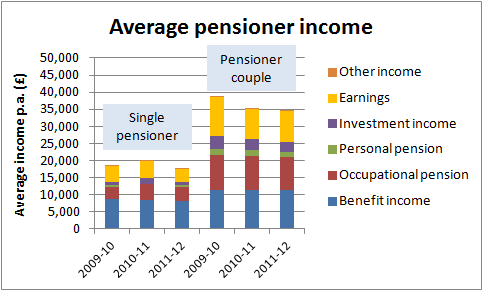
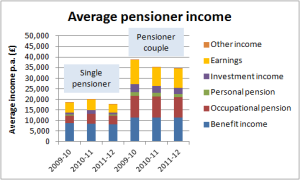
Typically income in retirement comes from multiple sources – state pension benefit, occupational pensions, personal pensions, investment income and earnings. On average a single pensioner has an income of around £18,000 p.a. and a pensioner couple of around £35,000 p.a. On average most income comes from state benefits, occupational pensions and earnings. [Source: DWP]

Ch8 Average pensioner incomes

Converting pension pots into income

Traditionally, we have saved for retirement by making regular contributions to a pension scheme with the expectation that only one option broadly-speaking will be available on retirement – purchase of an annuity (with the possibility of taking up to a quarter as a tax free lump sum). And that it was ‘pot luck’ as to what retirement income we would get, depending on the annuity rates at the time we decide to retire. Worse still, most people have just accepted the annuity product offered by the firm they saved with for their pension.

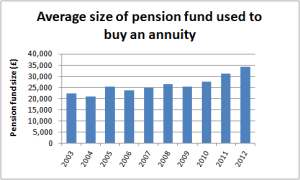
The average pension pot on retirement has grown in size from over £20,000 in 2004 to around £35,000 in 2012. [Source: ABI]

Ch9 Average size of pension fund

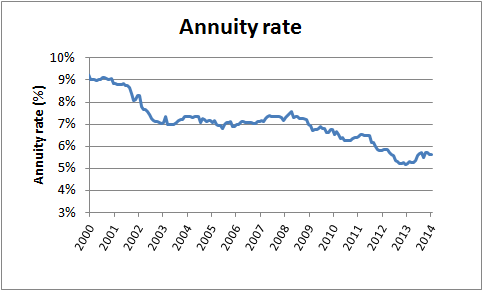
However, typical annuity rates have fallen significantly over the last decade from around 9% in 2001 to around 7% from 2003 to 2008, to around 5.5% in 2014. [Source: WilliamBurrows.com]

Ch10 Annuity rate

Growing pension pots combined with falling annuity rates have resulted in relatively flat average income of between £1,500 and £2,000 p.a. And over recent years there has been an inevitable drop in annuity sales from around 460,000 in 2009 to around 350,000 in 2013. [Source: ABI]

What’s changed?

As private pension schemes benefit from tax advantages, they are subject to rules relating to aspects such as annual and lifetime allowances, how the funds may be used on retirement, what lump sums may be taken and how they are taxed.

Some of these rules will stay in place, whilst others are changing.

Saving for retirement

Annual and lifetime limits have been reduced over recent years and it’s not certain if they’ll continue to fall or not. Some have suggested there may be advantages to unifying policies around pensions and other tax-efficient saving such as ISAs into a single approach. Indeed, the Treasury Committee appears to be enthusiastic about the idea as ‘a great prize’ which attracts ‘cross-party support’:

“[…] there may be scope in the long term for bringing the tax treatment of savings and pensions together to create a ‘single savings’ vehicle that can be used—with additions and withdrawals—throughout working life and retirement. This would be a great prize. The cross-party support for these savings and pensions announcements offers the prospect of a more stable and healthy environment for pension and savings taxation.”

Planning for retirement

Planning for retirement has three parts: firstly, guaranteed free advice or guidance to be offered to those on defined contribution schemes; secondly, further advice and support sought by people on retirement beyond the guaranteed free advice; and thirdly, ongoing support on financial decision through retirement years.

As part of the pension changes the Chancellor announced that the government would

“[…] introduce a new guarantee, enforced by law, that everyone who retires on these defined contribution schemes will be offered free, impartial, face-to-face advice on how to get the most from the choices they will now have.”

HMT outlines that the advice or guidance must follow standards developed by FCA and others:

“In order to ensure that this guidance really is impartial and high quality, providers and trust-based schemes will be required to ensure that the guidance follows a set of robust standards. […] The government will ask the FCA (working closely with the Pensions Regulator and the Department for Work and Pensions in relation to standards for trust-based pension schemes) to coordinate the development of these standards and the framework for monitoring compliance.”

The Treasury acknowledges that people may seek further advice – through regulated investment advice or an annuity brokerage service – or may invest their pension savings without advice (execution only), for example drawing on information sources and comparison sites.

“The government will work with the FCA to explore the extent to which regulated advice can be made more affordable through more cost effective delivery, such as through the development of online delivery channels.”

Taking advantage of the flexibility available to them, retirees will also want ongoing support with financial decisions through their retirement years, for example concerning care needs and inheritance planning.

The market for advice is large and constantly refreshed as more people approach and reach pension age. There are currently around 12 million individuals at or above state pension age with around 600,000 to 700,000 each year reaching state pension age at least to 2018. [Source: The Telegraph]

In-retirement income and drawings

Retirees have been required to buy an annuity using their funds accumulated in a pension scheme. Annuity rates have deteriorated in recent years leading to dissatisfaction with pension products. The market for pension and annuity products has been dominated by insurance companies.

The requirement to purchase an annuity with the proceeds of defined contribution schemes is to be removed.

The proposed reforms to pension rules mean at least two changes to the sector:

  • The opening up of the market for fund management firms to offer saving and income products for retirement; and
  • Increased demand before and following retirement for advisory services around financial decisions.

The greater flexibility over access to lump sums in retirement may also drive changes to nearby markets, for example the approach to long-term debt (e.g. mortgages for older borrowers) and covering ongoing care costs.

Where’s the opportunity?

Saving for retirement

A clear opportunity is product innovation targeting the market for long-term savings products that are not tied to conversion to annuity products – opening up competition to insurance companies from fund managers.

As pressures for integrating pension and other tax-efficient savings schemes under a unified approach increases the move to whole-life savings and investments products will open new opportunities for product innovators and IFAs. For example, demand for whole life planning whilst saving may become more prevalent.

Planning for retirement

The advice or guidance guaranteed by the Chancellor in Budget 2014 is likely to become an obligation on those providing defined contribution schemes.

Two types of opportunity may arise here: firstly, for additional and ongoing support and advice on financial decisions (likely to be regulated by the FCA); and secondly, for tools and information used either directly by consumers or by those providing financial support and advice.

With the new flexibility in how funds can be used a more comprehensive approach to investment decisions may emerge addressing, for example lifestyle ambitions, their cash flow implications, selection of product types to generate the desired cash flows, choice of specific products, execution of those choices, and anticipating unlikely events.

In retirement

A key area for innovation is improved transparency and efficiency in the annuity market (for many an annuity will remain the best choice of in-retirement product) promoting greater competition and better value for customers.

Product innovation may flourish in new types of in-retirement product that allow flexibility between taking an income and drawing lump sums and for example allowing top-ups to annuity funds (say, from home equity release or inheritances) to increase income.

Approaches may emerge that consider accumulated wealth across equity in homes, pension funds and other investments and help retirees make trade-offs between, for example, equity release and drawing on pension pots.

Beyond meeting immediate lifestyle needs in retirement, demand may grow for products and services offering some protection against or planning for care costs, inheritance, supporting family members with lump sum, etc.

Conclusion

Whilst the details and implications have still to be worked through, the simplification in pension rules could lead to wide ranging changes for the insurance, fund management and IFA sectors and possibly beyond.

The challenge is to ensure innovation isn’t stifled by new regulatory requirements and that government intervention to ‘help’ new approaches (such as for guaranteed advice or guidance) doesn’t displace entrepreneurial activity.

In particular, there is an attractive opportunity for tech-enabled innovators to reform a rather poor customer experience offering  limited product choice. With a cost-laden and opaque business model, the established ‘retirement finance’ industry is ripe for radical change.


To explore opportunities in the Retirement Finance market further, contact The Venturing Firm for an initial meeting.


Sources

HMT, Budget Speech, March2014: https://www.gov.uk/government/speeches/chancellor-george-osbornes-budget-2014-speech

HMT, Freedom and Choice in Pensions, March 2014: https://www.gov.uk/government/uploads/system/uploads/attachment_data/file/294795/freedom_and_choice_in_pensions_web_210314.pdf

HMT, Pensions: ending the requirement to annuitise, March 2014: www.parliament.uk/briefing-papers/sn00712.pdf

Treasury Committee, Report on 2014 Budget, May 2014: http://www.parliament.uk/business/committees/committees-a-z/commons-select/treasury-committee/news/budget2014report/

HMRC, Personal Pensions Statistics, February 2014: https://www.gov.uk/government/uploads/system/uploads/attachment_data/file/285063/pensions-intro.pdf

PPI, Pension Facts, November 2013: http://www.pensionspolicyinstitute.org.uk/pension-facts/pension-facts-tables

DWP, The Pensioners’ Incomes Series, July 2013: https://www.gov.uk/government/uploads/system/uploads/attachment_data/file/211685/pi-series-1112.pdf

ONS, Family Spending, December 2013: http://www.ons.gov.uk/ons/rel/family-spending/family-spending/2013-edition/index.html

ONS, Household Pension Resources, October 2012: http://www.ons.gov.uk/ons/dcp171766_281063.pdf

William Burrows, Annuity Line Chart: http://www.williamburrows.com/charts/annuity10k.aspx

ABI, The Annuity Market Facts and Figures, February 2014: https://www.abi.org.uk/~/media/Files/Documents/Publications/Public/2014/Pensions/The%20UK%20Annuity%20market%20Facts%20and%20Figures.ashx

ABI, Long-term insurance statistics update, 2012: https://www.abi.org.uk/News/Industry-data-updates/2013/08/Long-term-insurance-statistics-update

FT Advisor, interview with Paul Smee of Council of Mortgage Lenders, May 2014: http://www.ftadviser.com/2014/05/07/ifa-industry/tax-planning/pension-changes-will-ripple-through-industry-cml-ivDQnWkSUB7vryAQEbVbSN/article.html

The Telegraph, “Record numbers reach retirement age as baby boomers turn 65”, September 2012: http://www.telegraph.co.uk/finance/personalfinance/pensions/9563647/Record-numbers-reach-retirement-age-as-baby-boomers-turn-65.html

Green Deal: lacking product/ market fit?

DECC has recently published the latest statistics for Green Deal up to April 2014. With linear growth in Green Deal plans, are players still trying to find a product/ market fit?

What is the Green Deal?

The Green Deal is a government-sponsored initiative to give householders access to loans for improving energy efficiency of their homes.

Loans are subject to a ‘golden rule’ that means householders pay no more for the combinations of energy bills (i.e. electricity and gas), interest charges and loan repayment than they would have done without the home improvements. Loans are associated with the meter point and not the householder, so when the householder moves home, the loan stays behind for the new owner or tenant to pay.

The Green Deal is one element of DECC‘s policy on energy efficiency for householders.

Customer need

Improved energy efficiency is a major component of how the UK aims to reduce its emissions footprint and achieve its carbon targets.

The challenge, and the big win, is solving the retrofit problem.

The issue here is how to motivate householders to invest in energy efficiency measures. To date, rising energy bills, growing awareness about climate change, and political interventions have done little to drive behaviour change in householders. Much of the success in improving energy efficiency to date has been through obligations placed on the energy supply companies.

The Green Deal is an attempt to engage the majority of householders in investing to improve the energy efficiency of their homes, thereby reducing energy demand (and bills) and cutting emissions.

The market

This is a big potential market with the ONS reporting over 26 million UK households spending in 2012 around £32 billion a year on domestic energy and £4.5 billion on domestic appliances.

Globally, the energy efficiency retrofit problem is repeated across developed economies – North America, Japan and Europe are key markets.

With an addressable market in the UK of 26 million households, around 20,000 assessments are completed each month, i.e. less than 1% of the market is assessed each year. Of those, less than 2% are converted into confirmed Green Deal plans.

Opportunity

So far we have seen linear growth in Green Deal plans which suggests poor traction for the product on offer.

GD plans to end Apr-14

Having been live for around a year now, the Green Deal exhibits the chaotic and volatile behaviour we’d expect for a new venture.

Robust growth dynamic have yet to take hold – numbers of newly confirmed plans, plans newly being installed and newly live plans are all over the place. This suggests the players have yet to discover effective sales machines (for conversion from assessments) and execution machines (for moving plans smoothly between development stages).

Newly confirmed to end Apr-14

There is an increasing stock of assessments not converted into Green Deal plans – what is happening to these assessments? Are players mining these for sales opportunities?

The stock of confirmed plans is growing steadily. Given under-utilisation of Green Deal Providers (on average, they each managed around 8 pre-live and 8 live plans in April) and Green Deal approved installers (less than 20 plans per 100 installers in April), why is there a bottleneck in moving plans from confirmed to being installed?

The number of plans being installed is flat’ish at around 500 (±100) each month. Does this represent a natural limit for installation? Or, when coupled with the growing stock of confirmed plans, is it poor operational performance?

Plans being installed to end Apr-14

Any reasonable view of the average workloads for Advisors, Providers and Installers suggests under-utilisation and over-supply. Of course, workload will be concentrated in a few players, with most being left with little or no work from the Green Deal. Is this picture right?

GDP utilisation to end Apr-14

Is there an opportunity here for a new entrant with good marketing and operations?

What’s next

To explore opportunities in the Green Deal market further, contact The Venturing Firm for an initial meeting.

Green Deal: analysis of latest data from DECC

As a follow up to our recent post on the Green Deal, take a look at our pack on Analysis of Green Deal data to end Mar-14.

In summary we conclude:

  • The Green Deal has been operating for around a year now and is exhibiting the volatile performance expected of an early stage market
  • Whilst there has been steady growth in confirmed plans over the last year, this has been linear growth with a static market of 500 outstanding confirmed plans and 500 plans installing at any time – for early stage markets working effectively we expect to see exponential growth
  • Conversion rates from assessments are falling and the time taken to move plans between stages of development is deteriorating – why is this when there are high numbers of players with low average utilisation?
  • Supply of Assessors, Providers and Installers has run ahead of demand, leaving players underutilised on average – of course, workload is likely to be concentrated in a very few players, with most having no or near to no work from the Green Deal each month
  • Whilst Green Deal attracts more and more players, overall marketing and execution effectiveness needs to improve substantially to create and sustain an attractive market

To explore opportunities in the Green Deal market further, contact The Venturing Firm for an initial.

Green Deal: a slow-moving, over-supplied market

The Green Deal was launched early in 2013. DECC has recently published the latest statistics for March 2014. Apart from a small uptick in March, the statistics give a picture of an over-supplied market, poor demand growth and disappointing conversion rates.


What is the Green Deal market?

Green Deal is a government-sponsored initiative to give householders access to loans for improving energy efficiency of their homes.

Loans are subject to a ‘golden rule’ that means householders pay no more for the combinations of energy bills (i.e. electricity and gas), interest charges and loan repayment than they would have done without the home improvements. Loans are associated with the meter point and not the householder, so when the householder moves home, the loan stays behind for the new owner or tenant to pay. Currently Green Deal loans are available at an interest rate of around 7% (see Which? for why it might be higher).

A range of businesses is involved in delivering the Green Deal initiative:

  • Advisors, who may or may not work for Assessor Organisations – they carry out the Green Deal assessment, identifying energy efficiency measures for a property and determining whether the ‘golden rule’ can be met and a Green Deal offered 
  • Green Deal Providers – they manage Green Deals through confirmation (where a householder decides to proceed with a Green Deal) and installation of energy efficiency measures, to ongoing live operation (dealing with problems, change in bill payer, etc) 
  • Green Deal Installers – they install the energy efficiency measures agreed for a Green Deal plan 
  • Electricity Supply companies – they collect Green Deal interest charges and loan repayments through the electricity bill 
  • Green Deal Finance Company – a consortium of City firms that provides one source of capital for Green Deal loans 

At the end of March 2014, 2,000 Green Deals have been confirmed, with 995 live and another 473 having started but yet to complete installation of energy efficiency measures.


Is there an opportunity?

I have been following the Green Deal since before it was invented (the Conservative party proposed a similar scheme for a limited number of boroughs whilst in opposition). I want the Green Deal to be a success.

The latest statistics describe a market still at the very earliest stages of development – over-supplied, poor demand growth and disappointing conversion rates. We may need to wait a while before a solid growth trend sets in.

Supply of Advisors, Providers and Installers has grown in line with expectations of demand. However, any reasonable view of current average workloads would be that these players are underutilised:

  • no more than 8 Green Deal assessments per month per Advisor 
  • around 8 live and 8 pre-live plans per Provider 
  • fewer than 30 active plans being installed per 100 installers 

Of course, workload is likely to be concentrated in a very few players, with most having no or near to no work from the Green Deal each month. Expectations have run ahead of reality.

Growth over the last 10 months in Green Deals looks linear. However, for new market opportunities we are looking for exponential growth, not linear growth. Had the market grown exponentially over the last 10 months, we would have seen compounded growth rates of around 35% per month, which would have been very impressive! We have to wait and see if the uptick in March is starting a growth trend or just part of the volatile statistics seen in early stage markets.

Conversion of assessments to confirmed Green Deals is very low – 18,000 assessments in February resulted in 246 newly confirmed Green Deals in March (I assume one month lag from assessment to confirmation). Conversion rates have fallen from around1.6% last year to around 0.8% for the last four months.

The average time before installation starts has increased from around 2 to 4.5 months for the last four months; average time taken to install energy efficiency measures has settled at around 3.5 months.

Currently, I would characterise this market as static, with around 500 outstanding confirmed plans and 500 installing plans at any time (certainly for the last 7 months). The number of live plans increases as installations complete. How many Providers and Installers are needed to service this market? In March 2014, there were 143 Green Deal Providers (of which 121 serve domestic properties) and 2,575 Green Deal Installers.

What type of innovation may we see?

If there is an opportunity in this market, it is probably for consolidation! The area most in need of innovation is an improvement in conversion rates from assessment to confirmed Green Deal plan, and from confirmed plan to installing.


To explore opportunities in the Green Deal market further, contact The Venturing Firm for an initial meeting.  


We help founders build new ventures